Site Operations
One live site plan, in sync with your data.
For site managers and operations teams.
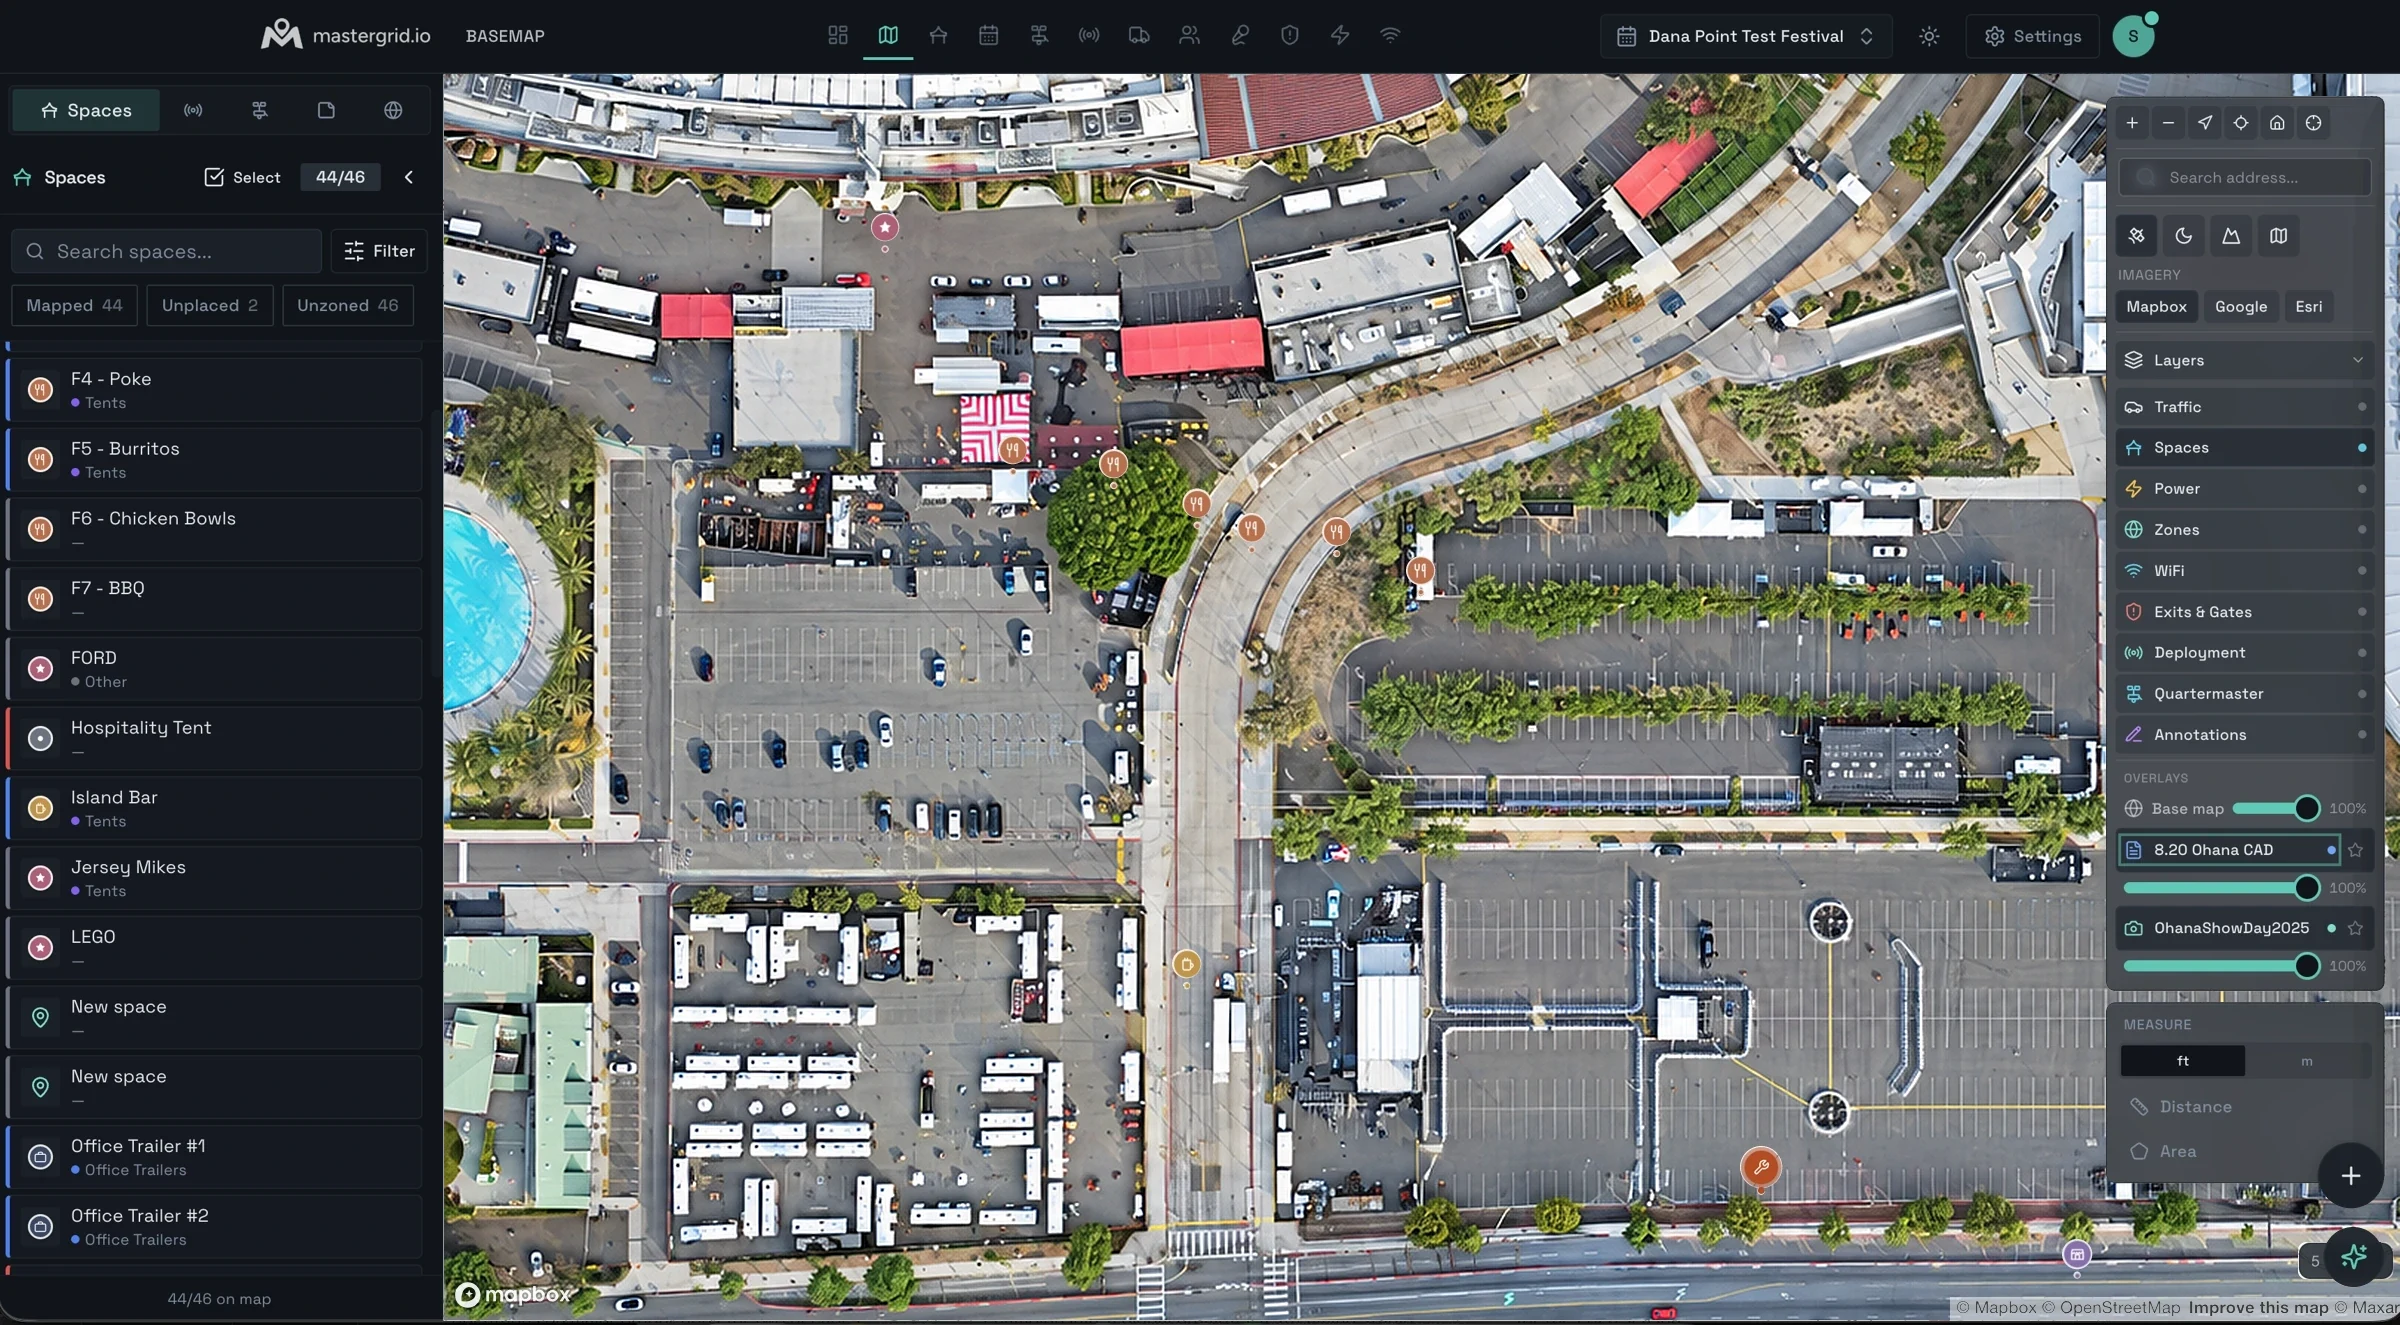
- Your CAD over the real ground. DWG, DXF or PDF, aligned with three control points.
- Fresh imagery when you need it. Drone scans and Nearmap on top of satellite, dark, terrain and streets.
- Every layer a toggle. Traffic, spaces, power, zones, WiFi, exits and gates, deployment, quartermaster.
- Measure on the drawing. Distance and area, notes where they belong, shared by named user.
Spaces Infrastructure & assignments
Tents, Mobile Offices and Structures as programmable records.
- Place a space on the map, program it directly or via the MasterGrid table. In sync with your CAD Site Plan DWG.
- Assign Departments, Vendors, Staff and create break-out schedules for specific spaces.
- Send forms to the specific space owners to gather what you need. Nothing changes on the record until you approve it.
- Workbook out, workbook in. Edit it in Excel or Sheets, import it back, and nothing duplicates.
Artist Catering
- Tents
- Mapped
- 12.0 kW
- WiFi
Readiness 2 of 4 ready
Identity
- Commodity
- Tents
- Use
- Food
- Size
- 40x60
- Quantity
- 1
- Dimensions
- 40 × 60 × 16 ft
- Coded ID
- RB-011
Assignments
- Department
- Artist Relations
- Vendor
- Bluegrass Tenting
- Zone
- —
- Staff
- —
Tents
- Type
- Structure Tent
- Leg height
- 16 ft
Schedule
- Load in
- Aug 20
- Load out
- Aug 28
- Occupied
- Aug 20 to Aug 28
Power
- House 20A
- RV 30A
- RV 50A
- CaliTwist
14-50 240V 1ph Qty 1 12.00 kW Unassigned
240V 1ph · 12.0kW 12.00 kW · 1 service
Network
WiFi POS terminals 50 Mbps Qty 2
1 100 Mbps
Furniture
- Chairs
- 160
- 6 ft tables
- 12
- Round tables
- 20
Location
- On the basemap
- Placed
- Zone
- —
- Coordinates
- 35.9118, -83.8718
History
Box Office
- Tents
- Mapped
- 4.8 kW
- WiFi
Readiness 0 of 4 ready
Identity
- Commodity
- Tents
- Use
- Ticketing
- Size
- 20x20
- Quantity
- 1
- Dimensions
- 20 × 20 × 12 ft
- Coded ID
- RB-003
Assignments
- Department
- Staffing
- Vendor
- Bluegrass Tenting
- Zone
- North Gate
- Staff
- —
Schedule
- Load in
- Aug 20
- Load out
- Aug 28
Power
- House 20A
- RV 30A
- RV 50A
- CaliTwist
Edison 20A 120V 1ph Qty 2 4.80 kW Unassigned
120V 1ph · 4.8kW 4.80 kW · 1 service
Network
WiFi needed. No service placed yet.
Furniture
- Chairs
- 12
- 6 ft tables
- 4
Location
- On the basemap
- Placed
- Zone
- North Gate
- Coordinates
- 35.9163, -83.8673
History
Info Booth
- Tents
- Mapped
- 2.4 kW
- WiFi
Readiness 0 of 4 ready
Identity
- Commodity
- Tents
- Use
- —
- Size
- 20x20
- Quantity
- 1
- Dimensions
- 20 × 20 × 12 ft
- Coded ID
- RB-018
Assignments
- Department
- Staffing
- Vendor
- Bluegrass Tenting
- Zone
- North Gate
- Staff
- —
Schedule
- Load in
- Aug 20
- Load out
- Aug 28
- Occupied
- Aug 20 to Aug 28
Power
- House 20A
- RV 30A
- RV 50A
- CaliTwist
Edison 20A 120V 1ph Qty 1 2.40 kW Unassigned
120V 1ph · 2.4kW 2.40 kW · 1 service
Network
WiFi needed. No service placed yet.
Furniture
- Chairs
- 12
- 6 ft tables
- 4
Location
- On the basemap
- Placed
- Zone
- North Gate
- Coordinates
- 35.9153, -83.8686
History
Medical Tent North
- Tents
- Mapped
- 7.2 kW
Readiness 0 of 2 ready
Identity
- Commodity
- Tents
- Use
- Medical
- Size
- 20x20
- Quantity
- 1
- Dimensions
- 20 × 20 × 12 ft
- Coded ID
- RB-007
Assignments
- Department
- Medical
- Vendor
- Bluegrass Tenting
- Zone
- North Gate
- Staff
- —
Schedule
- Load in
- Aug 21
- Load out
- Aug 27
Power
- House 20A
- RV 30A
- RV 50A
- CaliTwist
L14-30 240V 1ph Qty 1 7.20 kW Unassigned
240V 1ph · 7.2kW 7.20 kW · 1 service
Location
- On the basemap
- Placed
- Zone
- North Gate
- Coordinates
- 35.9158, -83.8701
History
| Name | Size | kW | |||||||||
|---|---|---|---|---|---|---|---|---|---|---|---|
| Artist Catering | Tents | 40x60 | Food | 8/20 | 8/28 | Bluegrass Tenting | Artist Relations | 12.0 kW | 160 | 12 | |
| Box Office | Tents | 20x20 | Ticketing | 8/20 | 8/28 | Bluegrass Tenting | Staffing | 4.8 kW | 12 | 4 | |
| Info Booth | Tents | 20x20 | — | 8/20 | 8/28 | Bluegrass Tenting | Staffing | 2.4 kW | 12 | 4 | |
| Medical Tent North | Tents | 20x20 | Medical | 8/21 | 8/27 | Bluegrass Tenting | Medical | 7.2 kW | 0 | 0 | — |
Schedule Timeline & tasks
One schedule, from advance to strike.
- Timeline, daily and list views of the same schedule, with anchor points and day labels so load-in, show days and load-out read at a glance.
- Import the spreadsheet you already have: the importer maps the columns and previews before writing, and re-importing the same file duplicates nothing.
- Day sheets and the master schedule report print from the schedule itself, and a delivery can name the truck that carries it.
Thu 20 to Mon 24 · 48 activities
DepartmentDept48
Thu 20 LOAD IN Crew call and site handover
6am12pm6pm
Fri 21
6am12pm6pm
Sat 22
6am12pm6pm
Sun 23
6am12pm6pm
Mon 24 SHOW DAY 1 Doors at 2pm
6am12pm6pm
Thu 20 August LOAD IN Crew call and site handover 9 activities
- 9:00 AM 1:00 PM Generator compound Site Ops · Generator Compound Scheduled
- 10:00 AM to Sat Main Stage steel build Production · Main Stage In progress
- 10:00 AM 2:00 PM Perimeter fence delivery Site Ops Scheduled
- 11:00 AM 12:00 PM Site walk and handover Production Scheduled
- 12:00 PM 3:00 PM Water and sanitation drop Site Ops Scheduled
- 12:00 PM 5:20 PM Safety Meeting Security Scheduled
- 1:00 PM 9:00 PM Stage roof and rigging Production · Main Stage Scheduled
- 2:00 PM 3:00 PM Cold storage container Food & Beverage Scheduled
- 5:00 PM 7:00 PM Vendor Row power tie-in Vendors Scheduled
Fri 21 August 10 activities
- from Thu to Sat Main Stage steel build Production · Main Stage In progress
- 10:00 AM 3:00 PM Main Stage PA fly Production · Main Stage Scheduled
- 10:00 AM 7:00 PM Vendor Row tent installs Site Ops + Vendors · Vendor Village In progress
- 11:00 AM 8:00 PM Power distribution pull Site Ops · Generator Compound In progress
- 11:00 AM 3:00 PM Fence line final Site Ops Scheduled
- 12:00 PM 4:00 PM Signage install East Gate No department Scheduled
- 12:00 PM 5:00 PM Medical tent fit-out Medical Scheduled
- 4:00 PM 6:00 PM CCTV and comms check Security Completed
- 7:00 PM 9:00 PM Volunteer orientation Staffing Completed
- 10:00 PM to Sat Lighting rig focus Production · Main Stage In progress
Sat 22 August 13 activities
- from Thu 9:00 PM Main Stage steel build Production · Main Stage In progress
- from Fri 2:00 AM Lighting rig focus Production · Main Stage In progress
- 9:00 AM 12:30 PM Restroom pump Site Ops Completed
- 10:00 AM 8:00 PM River Stage build Production · River Stage In progress
- 11:00 AM 12:30 PM Site safety walk Medical Delayed
- 12:00 PM 6:00 PM Video wall install Production · Main Stage Scheduled
- 1:00 PM 2:00 PM All-hands production meeting Every department Scheduled
- 1:00 PM 3:00 PM Bar stock delivery Food & Beverage Scheduled
- 2:00 PM 4:00 PM Artist advance calls Artist Relations Scheduled
- 4:00 PM 6:00 PM Light tower staging Site Ops Scheduled
- 4:00 PM 7:00 PM Signage sweep Site Ops Scheduled
- 6:00 PM 8:00 PM Radio distribution Staffing Scheduled
- 7:00 PM 8:00 PM Barricade plan walk Security Scheduled
Sun 23 August 10 activities
- All day Crew catering opens Food & Beverage Scheduled
- 11:00 AM 3:00 PM Water station install Site Ops Scheduled
- 12:00 PM 3:00 PM Crew credential pickup Staffing Scheduled
- 12:00 PM 6:00 PM Sponsor activation build No department Cancelled
- 1:00 PM 6:00 PM Health inspection Vendors Scheduled
- 1:00 PM 3:00 PM Barricade delivery Security Scheduled
- 5:00 PM 7:00 PM Main Stage line check Production · Main Stage Scheduled
- 6:00 PM 6:45 PM Medical briefing Medical Scheduled
- 7:00 PM 9:00 PM River Stage PA tune Production · River Stage Scheduled
- 8:00 PM 9:30 PM Final site walk Every department Scheduled
Mon 24 August SHOW DAY 1 Doors at 2pm 9 activities
- 9:00 AM 10:00 AM Ice delivery Food & Beverage Scheduled
- 1:00 PM 3:00 PM Main Stage sound check Production · Main Stage Scheduled
- 3:00 PM 9:00 PM Volunteer shift A Staffing Scheduled
- 4:30 PM 5:00 PM Gate open readiness check Security · North Gate Scheduled
- 5:00 PM Gates open Security Scheduled
- 6:00 PM 6:30 PM Ice run Food & Beverage Scheduled
- 9:00 PM 9:30 PM Medical staffing handover Medical Scheduled
- 9:00 PM to Mon Volunteer shift B Staffing Scheduled
- 9:00 PM 9:30 PM Security shift change Security Scheduled
| Activity | Start | Status | ||||
|---|---|---|---|---|---|---|
| Generator compound | Setup | Site Ops | Thu 9:00 AM | 1:00 PM | Scheduled | Generator Compound |
| Main Stage steel build | Setup | Production | Thu 10:00 AM | Sat 9:00 PM | In progress | Main Stage |
| Perimeter fence delivery | Delivery | Site Ops | Thu 10:00 AM | 2:00 PM | Scheduled | — |
| Site walk and handover | Meeting | Production | Thu 11:00 AM | 12:00 PM | Scheduled | — |
| Water and sanitation drop | Delivery | Site Ops | Thu 12:00 PM | 3:00 PM | Scheduled | — |
| Safety Meeting | Meeting | Security | Thu 12:00 PM | 5:20 PM | Scheduled | — |
| Stage roof and rigging | Setup | Production | Thu 1:00 PM | 9:00 PM | Scheduled | Main Stage |
| Cold storage container | Delivery | Food & Beverage | Thu 2:00 PM | 3:00 PM | Scheduled | — |
| Vendor Row power tie-in | Activity | Vendors | Thu 5:00 PM | 7:00 PM | Scheduled | — |
| Main Stage PA fly | Setup | Production | Fri 10:00 AM | 3:00 PM | Scheduled | Main Stage |
| Vendor Row tent installs | Setup | Site Ops + Vendors | Fri 10:00 AM | 7:00 PM | In progress | Vendor Village |
| Power distribution pull | Setup | Site Ops | Fri 11:00 AM | 8:00 PM | In progress | Generator Compound |
| Fence line final | Activity | Site Ops | Fri 11:00 AM | 3:00 PM | Scheduled | — |
| Signage install East Gate | Activity | — | Fri 12:00 PM | 4:00 PM | Scheduled | — |
| Medical tent fit-out | Setup | Medical | Fri 12:00 PM | 5:00 PM | Scheduled | — |
| CCTV and comms check | Activity | Security | Fri 4:00 PM | 6:00 PM | Completed | — |
| Volunteer orientation | Meeting | Staffing | Fri 7:00 PM | 9:00 PM | Completed | — |
| Lighting rig focus | Activity | Production | Fri 10:00 PM | Sat 2:00 AM | In progress | Main Stage |
| Restroom pump | Setup | Site Ops | Sat 9:00 AM | 12:30 PM | Completed | — |
| River Stage build | Setup | Production | Sat 10:00 AM | 8:00 PM | In progress | River Stage |
| Site safety walk | Activity | Medical | Sat 11:00 AM | 12:30 PM | Delayed | — |
| Video wall install | Setup | Production | Sat 12:00 PM | 6:00 PM | Scheduled | Main Stage |
| All-hands production meeting | Meeting | Every department | Sat 1:00 PM | 2:00 PM | Scheduled | — |
| Bar stock delivery | Delivery | Food & Beverage | Sat 1:00 PM | 3:00 PM | Scheduled | — |
| Artist advance calls | Meeting | Artist Relations | Sat 2:00 PM | 4:00 PM | Scheduled | — |
| Light tower staging | Delivery | Site Ops | Sat 4:00 PM | 6:00 PM | Scheduled | — |
| Signage sweep | Activity | Site Ops | Sat 4:00 PM | 7:00 PM | Scheduled | — |
| Radio distribution | Activity | Staffing | Sat 6:00 PM | 8:00 PM | Scheduled | — |
| Barricade plan walk | Meeting | Security | Sat 7:00 PM | 8:00 PM | Scheduled | — |
| Crew catering opens | Milestone | Food & Beverage | Sun Aug 23 · All day | — | Scheduled | — |
| Water station install | Setup | Site Ops | Sun 11:00 AM | 3:00 PM | Scheduled | — |
| Crew credential pickup | Activity | Staffing | Sun 12:00 PM | 3:00 PM | Scheduled | — |
| Sponsor activation build | Setup | — | Sun 12:00 PM | 6:00 PM | Cancelled | — |
| Health inspection | Milestone | Vendors | Sun 1:00 PM | 6:00 PM | Scheduled | — |
| Barricade delivery | Delivery | Security | Sun 1:00 PM | 3:00 PM | Scheduled | — |
| Main Stage line check | Activity | Production | Sun 5:00 PM | 7:00 PM | Scheduled | Main Stage |
| Medical briefing | Meeting | Medical | Sun 6:00 PM | 6:45 PM | Scheduled | — |
| River Stage PA tune | Activity | Production | Sun 7:00 PM | 9:00 PM | Scheduled | River Stage |
| Final site walk | Meeting | Every department | Sun 8:00 PM | 9:30 PM | Scheduled | — |
| Ice delivery | Delivery | Food & Beverage | Mon 9:00 AM | 10:00 AM | Scheduled | — |
| Main Stage sound check | Activity | Production | Mon 1:00 PM | 3:00 PM | Scheduled | Main Stage |
| Volunteer shift A | Activity | Staffing | Mon 3:00 PM | 9:00 PM | Scheduled | — |
| Gate open readiness check | Milestone | Security | Mon 4:30 PM | 5:00 PM | Scheduled | North Gate |
| Gates open | Milestone | Security | Mon 5:00 PM | — | Scheduled | — |
| Ice run | Delivery | Food & Beverage | Mon 6:00 PM | 6:30 PM | Scheduled | — |
| Medical staffing handover | Meeting | Medical | Mon 9:00 PM | 9:30 PM | Scheduled | — |
| Volunteer shift B | Activity | Staffing | Mon 9:00 PM | 3:00 AM | Scheduled | — |
| Security shift change | Activity | Security | Mon 9:00 PM | 9:30 PM | Scheduled | — |
Quartermaster Equipment & supplies
Know where every piece of kit is, and when.
- Light Tower
- Forklift
- UTV
- Golf Cart
- Lift
- Radio
- Tools
- Traffic Control
- PPE
- Equipment with categories, types, ownership, fuel, status and department. Start from an industry standard template or customize your own fleet of assets.
- Check out, track custody and stay compliant. Signing waivers is made easy: a signature and a photo of their ID at the cage, kept on every unit until it comes back.
- Signage designs with placements on site, and truck manifests as a day-by-day board, printable for the gate.
Check Out / In
- Select
- Details
- Confirm
Handset 9 available of 14 · RD-001 to RD-014
Charging Bank 1 available of 1 · RADIO-001
Headpiece 1 available of 1 · RADIO-002
Golf Cart 4-Passenger 3 available of 6 · GC-001 to GC-006
UTV 4-Passenger 2 available of 3 · UTV-001 to UTV-003
Warehouse 5K 2 available of 2 · FL-001, FL-004
Telehandler 10K 0 available of 1 · FL-002
Telehandler 15K 0 available of 1 · FL-003
Scissor Lift 30' 2 available of 3 · SL-001 to SL-003
Boom Lift 50' 1 available of 1 · BL-001
Diesel 6 available of 10 · LT-001 to LT-010
Barricade 1 available of 1 · BR-001
Cones & Delineators 1 available of 1 · CN-001
- Telehandler 10K FL-002 · with Theo Marsh OUT
- Handset RD-001 · with Iris Chen OUT
- Diesel light tower LT-001 · with Site Ops crew OUT
- UTV 4-Passenger UTV-001 · with Mesa Medical OUT
- Handset RD-007 · with Dana Whitfield OUT
- Handset RD-010 · with Avery Stone OUT
6 items
6 items Checking out 6 items OUT
- Checking out to
- Carlos Mendes
- Purpose
- Perimeter fence and gate lighting, load-in
- Department
- Site Ops
Photo ID (optional)
Power Electrical distribution
Plan the power. Measure the power. Report the carbon.
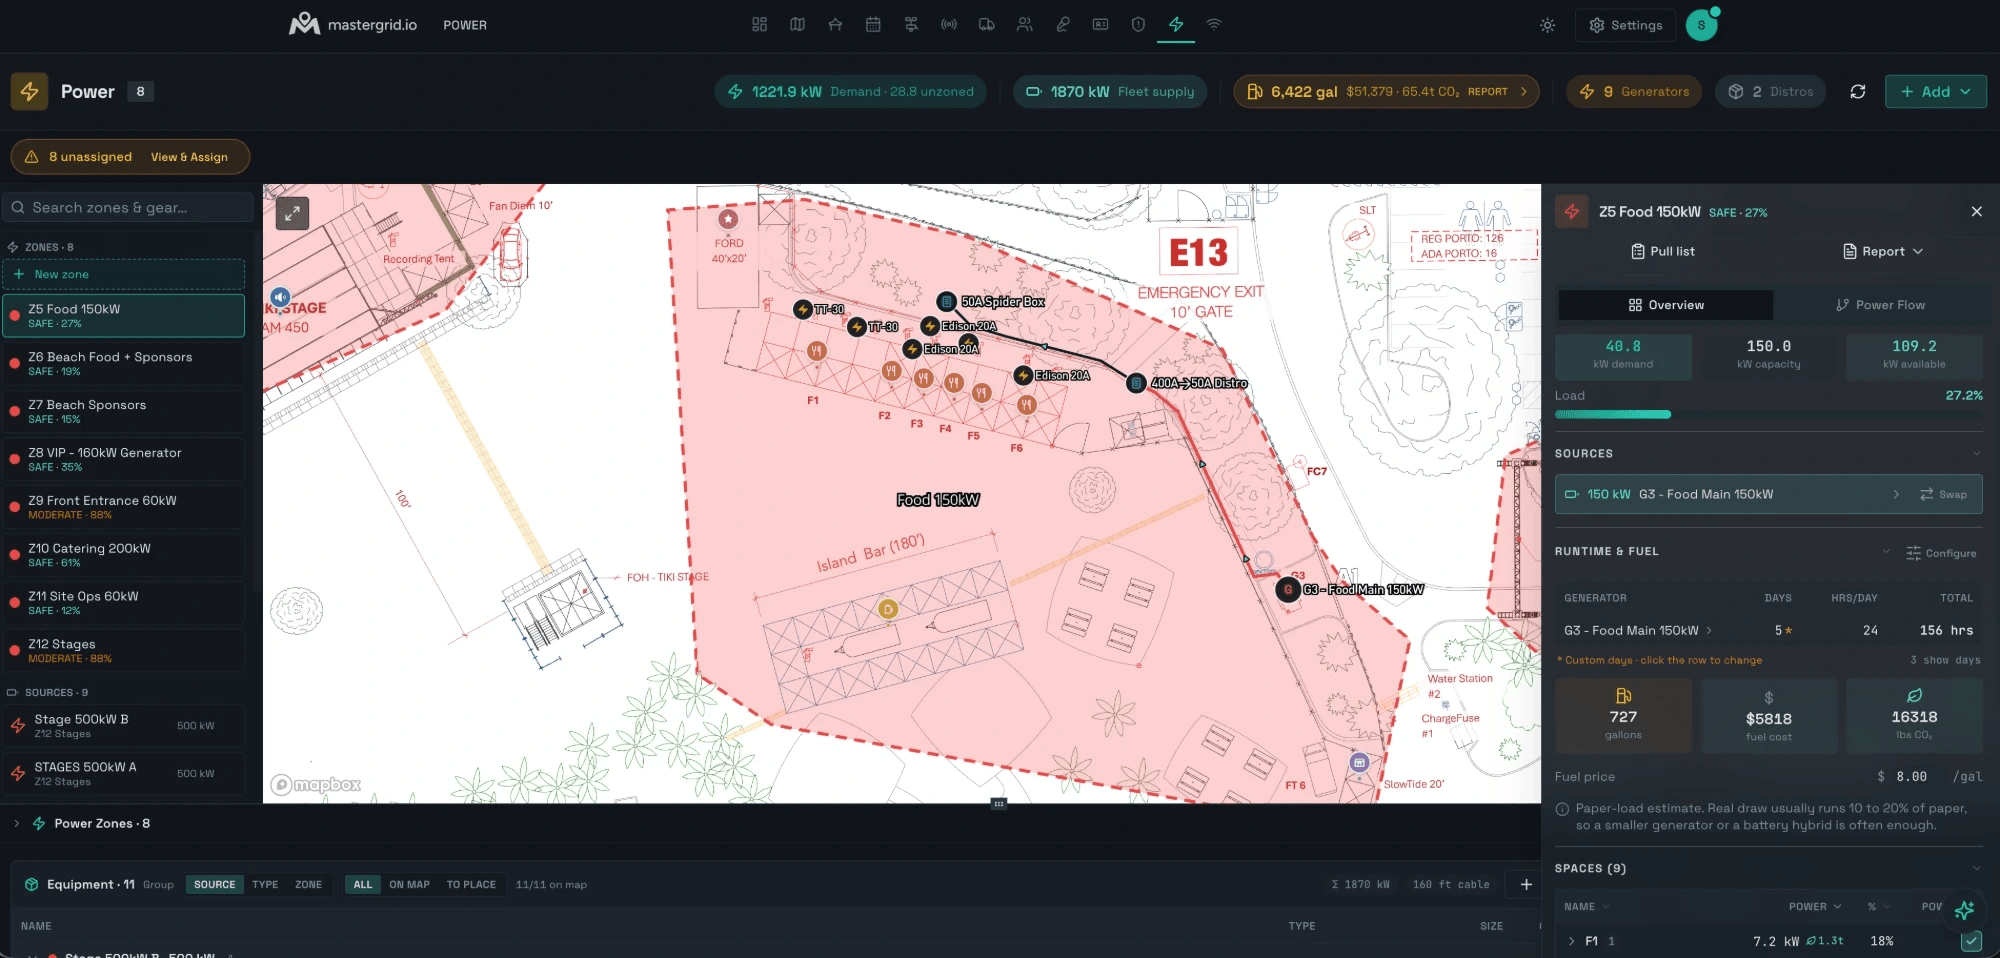
- Power Zones Zones with demand against attached capacity. Generators, batteries and grid services with real specs; distro and cables with true wire gauge and run weight.
- Energy Monitoring Clamp readings logged on site, with plan beside measured on every unit page.
- Fuel & Carbon Reporting A Fuel & Carbon report where every figure states its basis: measured on site, event plan, or per charge.
Networking Connectivity & WiFi
Dishes, access points and cameras, placed where they go.
- An equipment library of Starlink dishes, access points, PTZ and fixed cameras, switches and routers. Pick a model, click the map, and it is placed with nothing to fill in.
- Network zones drawn on the map carry a default SSID and a bandwidth target. Every device records what feeds it, and a space's WiFi or hard-line request is kept on the space.
- Cameras placed here appear as a layer on the Command map, beside the incidents.
Networking
- 220 Mbps uplink
- 1 zone
- 2 APs
- 2 cameras
Cameras
FAQ
Questions operators ask
What site plan formats can I bring in?
Does MasterGrid replace my CAD software?
Can I import the schedules and equipment lists we already have?
Where do the carbon figures come from?
Join the waitlist
We walk you through the platform on your own site plan and set up the license that fits — an Event License for one event, or a Venue & Enterprise agreement for permanent sites and multi-event operators.